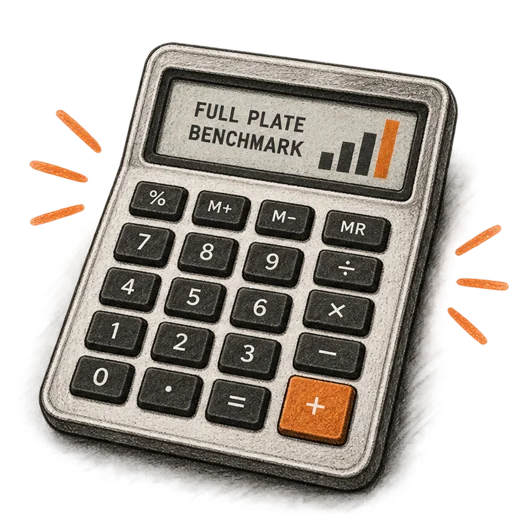
Quick Calculator
A fast gut-check. BENCHMARKING MEMBERSHIP
- Enter a few key metrics
- Get a quick performance snapshot
- See how you stack up
- Built for a fast first look



 @fullplateintel
Know where your
restaurant really stands
Full Plate Benchmark is being built to match your restaurant with the right peers and turn your numbers into actions. Better matches. Deeper insight. Real results.
BENCHMARKING MEMBERSHIP Paid, per-location benchmarking with options ranging from a quick performance snapshot to ongoing monthly reporting. Join the early-access list for launch details and founding-member access.


Compare against restaurants that are truly like you, not a national average.

Our model is designed to go beyond averages and show what actually drives performance.

Clear takeaways and smart recommendations you can act on right away.
A fast gut-check. BENCHMARKING MEMBERSHIP

In-depth analysis. Action-oriented insight. BENCHMARKING MEMBERSHIP
Upload. We analyze. You act. You improve.

Upload your P&L and chart of accounts securely in minutes.
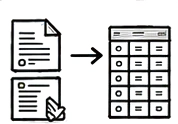
Your chart of accounts will be mapped to our standard framework, with a review step before anything is scored.

We capture your unique DNA across concept, cuisine, seats, size, service style & market.
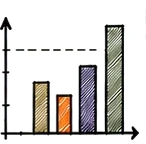
Your results are benchmarked against relevant peer restaurants.

See how you perform on key KPIs and get an overall grade.

Clear insights and operator actions you can put to work.
Implement. Improve. Repeat.
We compare apples to apples, so you get answers that matter.

What’s your concept and positioning?

What type of cuisine do you serve?

Where do you fall in revenue band?

How many seats do you have?
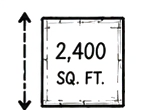
What’s your total square footage?

How do you serve your guests?

Where is your restaurant located?
Better matches. Deeper insight. Real results.
Planned safeguards. Financial uploads are not open yet.


You will upload your P&L and chart of accounts through an encrypted portal, once Benchmark opens.

Data will be encrypted in transit (TLS) and at rest.

Identifying details will be separated from your financial data before analysis.

Peer comparisons will be built from aggregated data across participating restaurants, not from any single restaurant.

You will receive benchmarks and scores built on aggregate comparisons.

Your individual data will not be sold. Permitted uses, including any contribution to aggregate research, will be stated in the participation terms you accept before uploading.