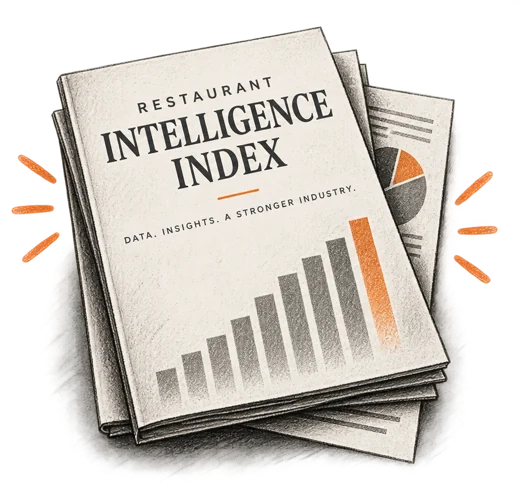



Restaurant
Intelligence Index
See what real restaurant
data is saying.
The twice-yearly
State of the Independent Restaurant Industry report.
PREMIUM RESEARCH REPORT Available for individual purchase with each twice-yearly edition. Join the early-access list for launch details and first access.
Real operating data from independent restaurants, interpreted through more than 25 years of advising restaurant owners and operators. Each edition will show what is changing across the industry, why it matters, and what deserves your attention next.
A paid report, published twice a year for independent restaurant operators. Join the list below for launch updates.

-

Numbers, not anecdotes
To be built from the operating data of independent restaurants, so you see what the industry is actually doing.
-

Signal, not noise
Sales, margins, costs, labor and sentiment read together, so a real shift stands apart from a loud month.
-

Interpretation you can use
Every signal comes with the why behind it and what to check in your own restaurant next.
Seven chapters. One clear picture of the industry.
Each edition will follow the same structure, so you can track what has moved from one report to the next.
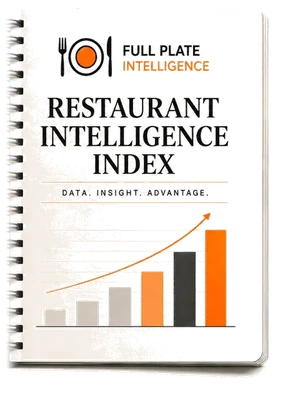
A report worth keeping on the desk.Published twice a year

01Industry Pulse
Where independent restaurants stand overall, and what moved since the last edition.

02Sales & Profitability
Revenue patterns and what they mean for margin at the operator level.
03Food & Beverage Costs
Cost movement across categories, and which pressures look structural.

04Labor & Productivity
Staffing, wages and output, read together rather than in isolation.

05Operator Sentiment
What operators themselves report about conditions and confidence.

06Technology & AI
Adoption worth taking seriously, separated from the noise.

07What We’re Watching
Early signals that may matter over the coming months.
From restaurant data to industry intelligence.
The planned research line: real operating data goes in, individual restaurants stay protected, and experience turns the patterns into something you can use.
-

Real restaurants
Financial and operating data from independent restaurants.
-

Anonymized
Identifiers are removed before analysis. No individual restaurant is named, and results are reported only in aggregate.
-

Aggregated & analyzed
Trends, shifts, outliers and early signals are identified across the whole set.
-

Interpreted
Restaurant operating experience adds the context the numbers cannot.
-
The Index
The signals that matter, published twice a year as clear, usable intelligence.

Built on real data. Handled responsibly.
The Index will report patterns across many restaurants, not the position of any one of them. How contributed data may be used, including any use across other Full Plate Intelligence products, will be set out in the participation terms before any data is collected.
- Anonymized & aggregated
- No individual restaurant identified
- Strict confidentiality
- Secure handling
 Steve’s Take
The numbers tell you what.
Experience helps explain why.
Every edition will combine restaurant operating data with more than 25 years of experience working alongside restaurant owners and operators.
The goal isn’t simply to report what changed. It’s to explain why it matters, what may be driving it, and what operators should be watching next.
Steve Dillberg, Full Plate Intelligence
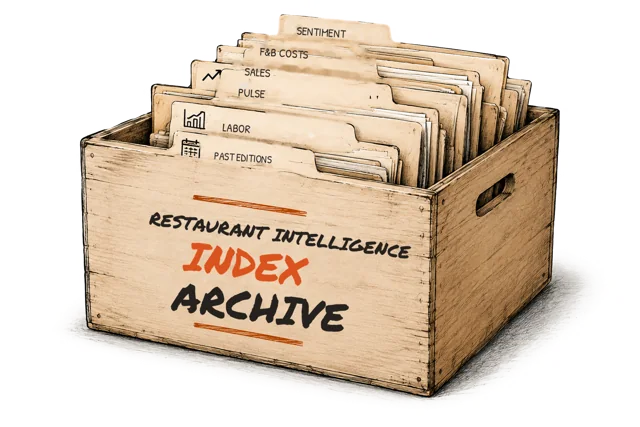
Intelligence Index coming soon.
Join the early-access list through Full Plate Weekly.